Weight Belt Pressure Mapping in Maximal Squats Draws from Platform Sensors and Competitor Records
Erik Brooks · Aug 8, 2026
Weight Belt Pressure Mapping in Maximal Squats Draws from Platform Sensors and Competitor Records
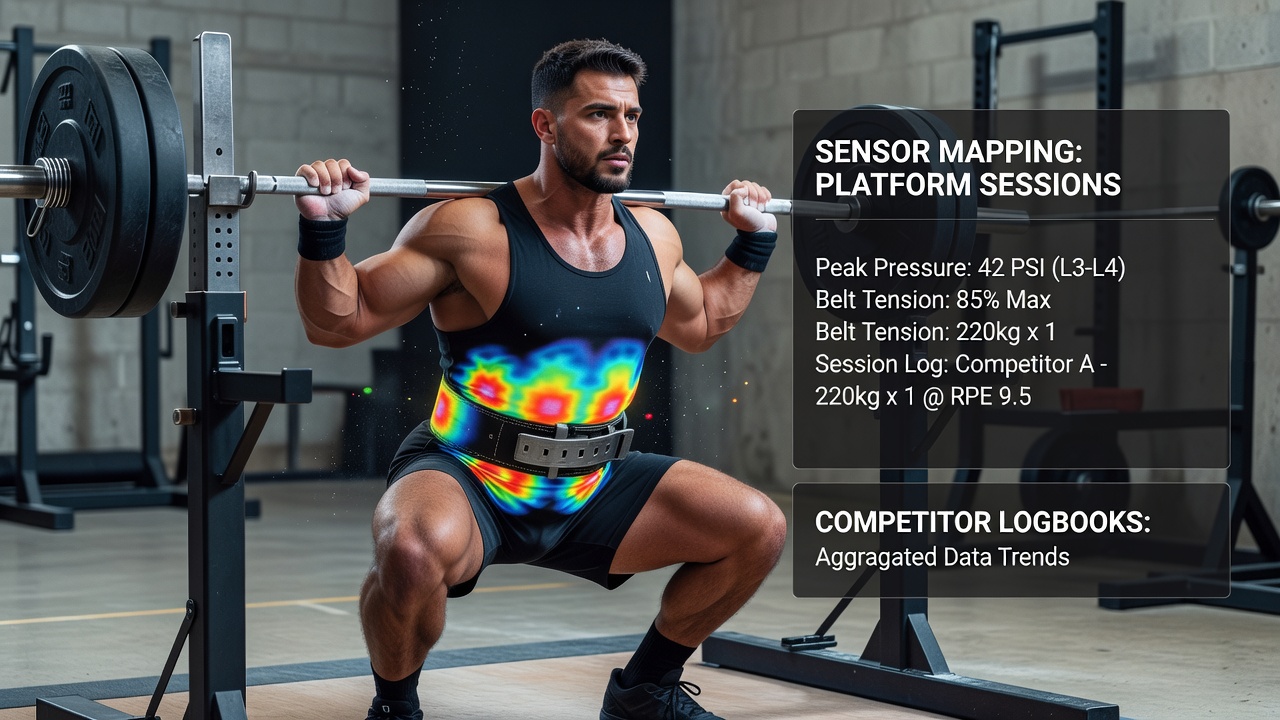
Platform sessions equipped with thin-film pressure sensors reveal distinct force concentrations along the lower back and abdominal contact zones when athletes perform maximal squats, while competitor logbooks record corresponding comfort levels and perceived stability across repeated attempts. Researchers at multiple training facilities have documented these patterns through synchronized data collection that pairs real-time pressure readings with post-session entries from powerlifters and weightlifters. The approach combines hardware measurements from force-sensitive resistors embedded in custom belts with qualitative notes athletes maintain during heavy training blocks.
Sensor Placement and Data Capture Methods
Technicians position sensor strips along the inner surface of weight belts at intervals that correspond to common contact areas above the iliac crest and across the lumbar region, then calibrate each array before loading begins. Sessions conducted in controlled environments capture pressure peaks during the eccentric and concentric phases of the squat, with sampling rates set at 100 hertz to track rapid shifts in force distribution. Athletes perform sets at 90 to 100 percent of one-repetition maximum while cameras record bar path and torso angle for later synchronization with the pressure traces.
Observed Pressure Patterns Across Multiple Athletes
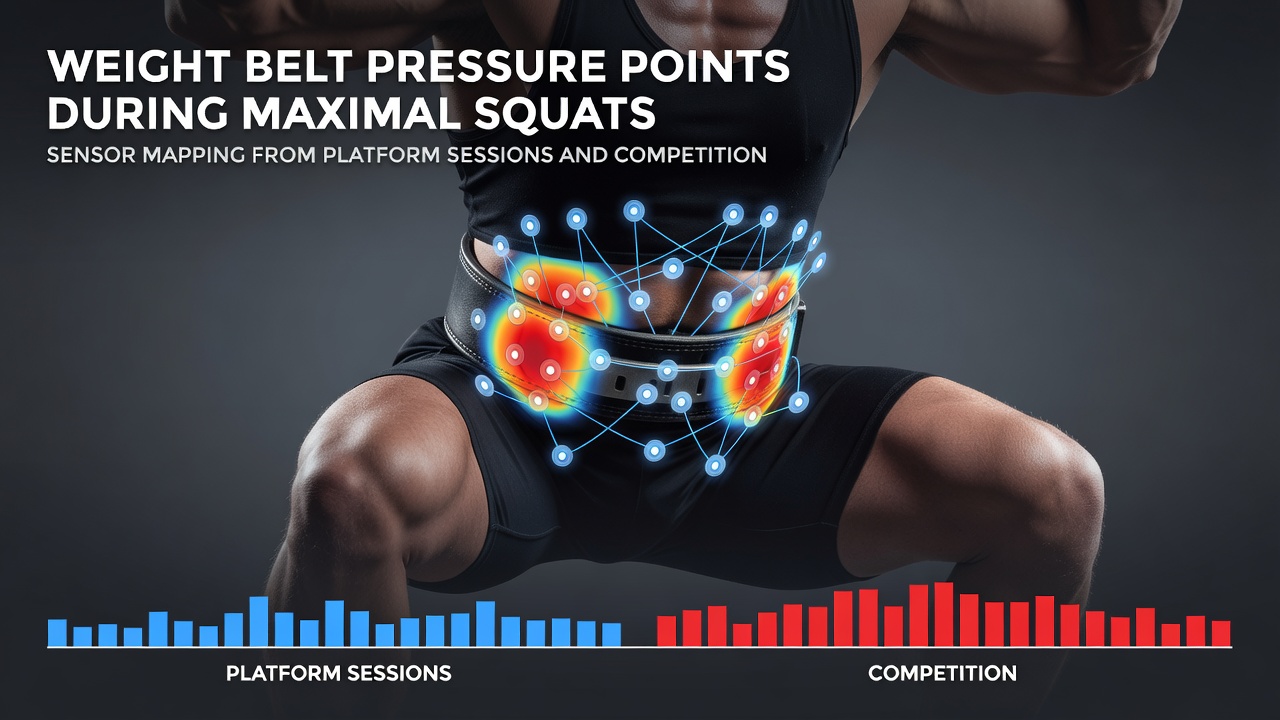
Readings from more than sixty platform sessions indicate that peak pressure often clusters near the posterior midline during the bottom position, reaching values between 180 and 240 kilopascals depending on belt width and tightening tension. Anterior sensors register lower but more variable forces that increase as the athlete braces the abdominal wall before ascent. Data collected through August 2026 shows consistent lateral asymmetry in roughly one-third of tested lifters, with higher readings on the side opposite the dominant hand.
Logbook Correlations with Sensor Output
Competitor logbooks maintained over multi-week training cycles note discomfort or belt migration that aligns with sensor spikes above 200 kilopascals in the lower lumbar zone. Entries frequently describe the need for mid-set adjustments when pressure maps display sustained loads on a single contact point for longer than three seconds. Those who cross-reference their written records with printed sensor graphs report that tightening the belt one additional notch sometimes redistributes force more evenly across the array, although the adjustment also elevates anterior readings in subsequent repetitions.
One study coordinated by an Australian sports institute matched pressure data from twenty-three national-level squatters with daily training diaries spanning eight weeks. The combined dataset revealed that belts worn at higher tension produced narrower pressure bands yet increased reports of restricted breathing during the heaviest singles. Researchers observed that athletes who logged belt repositioning between sets showed more uniform pressure maps on the following attempt.
Regional Variations and Equipment Differences
Comparative analysis across facilities in Canada and the European Union highlights modest differences tied to belt construction and typical training attire. Thicker suede belts used in some North American gyms distribute force over a broader area, resulting in lower peak pressures per square centimeter than the narrower nylon models common in European competitions. Logbook entries from both regions mention similar preferences for belt placement just above the hip bones, yet Canadian athletes recorded fewer complaints about skin irritation when sensors detected forces spread across multiple contact zones.
Additional trials at a university laboratory in the United States incorporated motion capture to examine how forward torso lean alters pressure distribution. Results indicated that increased forward pitch elevates posterior sensor values while reducing anterior readings, a pattern also noted in several competitor journals that describe belt slippage during high-bar versus low-bar squat variations.
Integration of Hardware and Written Records
Coaches and biomechanists now overlay sensor heat maps with digitized logbook excerpts to identify individual pressure thresholds that precede technique breakdown. The combined approach allows athletes to adjust belt positioning or tension before discomfort escalates, and facilities have begun archiving both data streams for longitudinal review. Sessions scheduled after August 2026 continue to expand the dataset with newer sensor materials that offer improved durability under repeated high-load conditions.
Conclusion
Platform sensor mapping paired with competitor logbooks supplies objective records of how weight belts interact with the torso during maximal squats. The merged information highlights consistent pressure concentrations while documenting how equipment choices and positioning influence force distribution across different training populations. Continued collection of synchronized hardware and written data supports refinement of belt design and usage guidelines for strength athletes.