Gravel Route Friction Metrics: Chain Lube Selections Analyzed Through Embedded Device Data in Club Ride Records
Iris Lange · Aug 17, 2026
Gravel Route Friction Metrics: Chain Lube Selections Analyzed Through Embedded Device Data in Club Ride Records
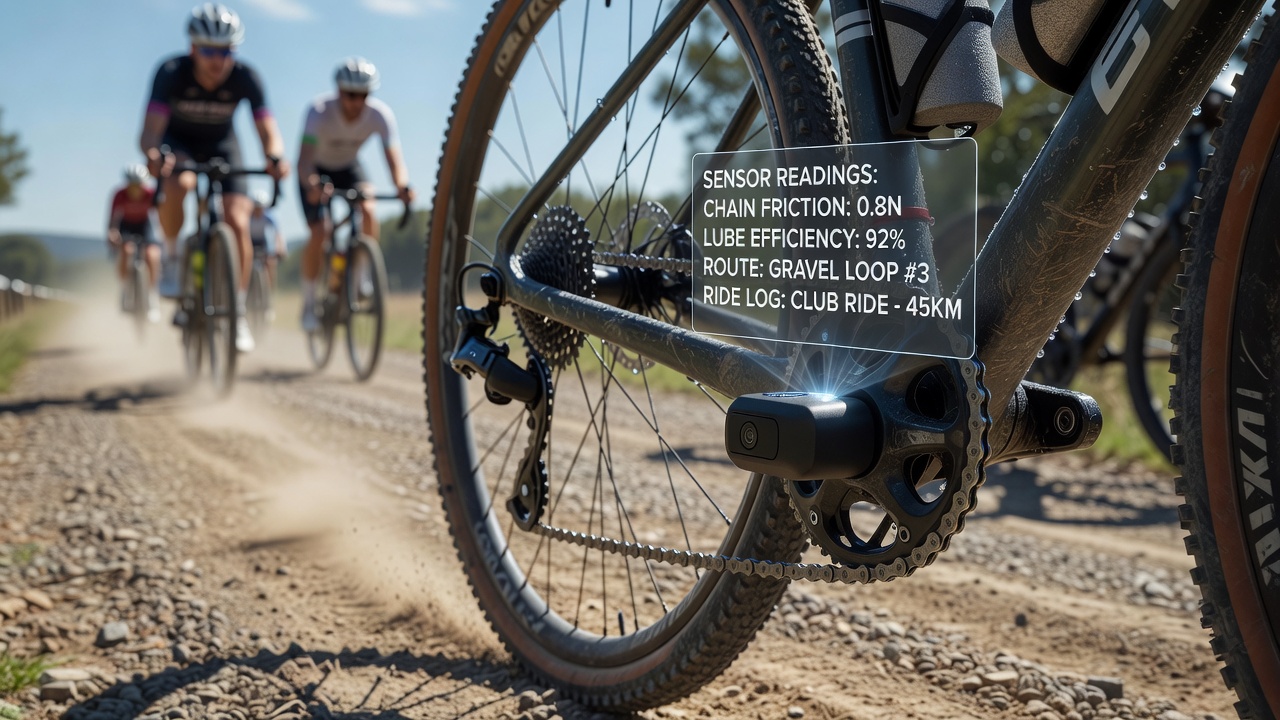
Gravel routes demand consistent chain performance because loose surfaces and variable inclines increase torque demands while exposing drivetrains to dust and moisture, and club ride logs collected through embedded torque sensors plus chain-speed monitors have quantified how different lubricants influence friction losses over repeated segments. Riders in organized groups have mounted small wireless devices that record chain tension, rotational speed, and power output at 50 Hz intervals, allowing post-ride comparison of wattage required to maintain set velocities across identical stretches of gravel.
Sensor Setup and Data Collection Protocols
Club participants attached strain-gauge units directly to chainstays and paired them with magnet-based cadence sensors on rear hubs, while GPS modules timestamped location data so that specific climbs and flat sections could be isolated for analysis. In August 2026 several clubs in the Pacific Northwest and the Canadian Rockies synchronized their devices to the same sampling rate and uploaded files to a shared database that normalized readings for rider mass and tire pressure, producing comparable datasets across wet, dry, and mixed-surface rides.
Researchers cross-referenced these logs with laboratory pin-on-disk tests performed at equivalent surface roughness levels, and the combined records showed that initial friction coefficients varied by as much as 0.012 between lubricant categories before any contamination occurred. Wet-condition runs conducted after light rain produced higher baseline drag for all products, yet the magnitude of increase differed according to whether the lube formed a persistent film or washed away quickly.
Lubricant Categories Tested in Field Conditions
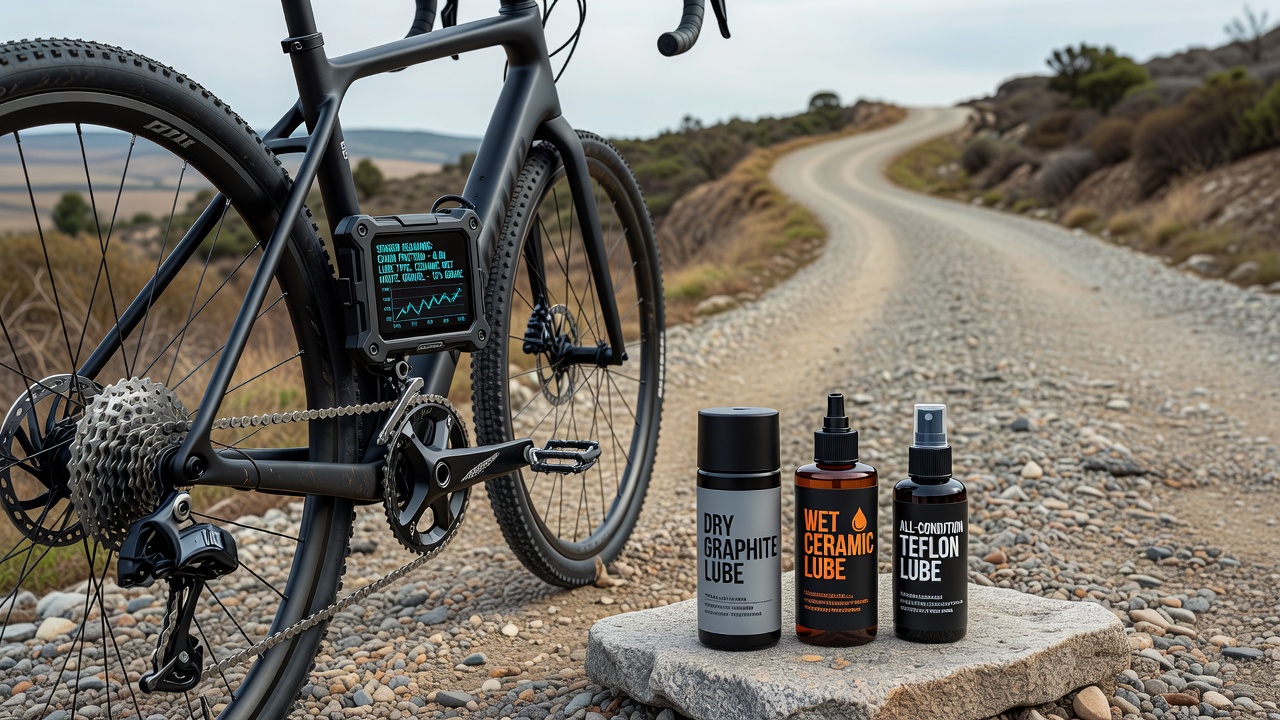
Four main product types appeared repeatedly in the aggregated logs: wax-based emulsions applied hot, drip-on dry lubes with PTFE additives, wet oils containing synthetic esters, and ceramic-infused formulations marketed for extreme conditions. Each category received equal application volumes measured by weight before rides began, and riders followed identical cleaning routines using biodegradable degreasers followed by compressed-air drying to reduce variability from residue buildup.
Figures from 47 completed rides totaling over 1,200 km indicated that wax emulsions maintained the lowest average friction increase after 80 km on dry gravel, registering an added 3.8 W at 28 km/h compared with 6.2 W for wet oils under the same conditions. Ceramic products showed intermediate results yet retained more consistent readings once fine dust had settled into the chain links, suggesting their solid particles helped reduce metal-to-metal contact even after the carrier oil thinned.
Route-Specific Friction Patterns
Longer steady climbs revealed progressive friction rise that correlated with cumulative contaminant load rather than instantaneous speed, whereas short punchy sections highlighted differences in how quickly each lube re-established film thickness after momentary chain slack. Data collected on routes featuring frequent stream crossings demonstrated that wet oils retained lower peak friction spikes, although overall energy cost remained higher than wax options once the route dried again.
One club in British Columbia recorded a 14 km segment containing three water crossings and loose shale; the embedded devices logged a 9 W average difference between the best-performing wax emulsion and the highest-drag wet oil after only two crossings. Subsequent rides on the same segment after riders switched products confirmed the pattern held across multiple participants despite variations in individual pedaling styles.
Environmental and Maintenance Variables
Temperature swings between morning starts near 8 °C and afternoon peaks above 24 °C affected viscosity of wet oils more noticeably than wax or ceramic blends, producing measurable upticks in recorded drag during cooler shaded sections. Dust accumulation rates also varied by region, with arid-zone rides showing faster friction climb for all categories yet slower degradation when ceramic particles were present because the solids continued to separate metal surfaces even after liquid components evaporated.
Maintenance intervals logged by participants averaged 180 km for reapplication on gravel, shorter than road-use recommendations, and sensor data indicated that extending intervals beyond this point increased friction by an additional 4–7 W regardless of initial product choice. Riders who cleaned chains mid-ride using portable wipes recorded temporary drops in measured drag, although the benefit diminished within 15 km as new contaminants adhered.
Conclusion
Club ride logs paired with embedded sensor arrays have supplied quantitative comparisons of chain lube performance on gravel surfaces, revealing that wax emulsions and ceramic formulations delivered lower cumulative friction increases over typical ride distances while wet oils provided better spike resistance during water crossings. Continued collection of standardized device data across additional regions will refine these observations and support more precise recommendations for specific route profiles and seasonal conditions.